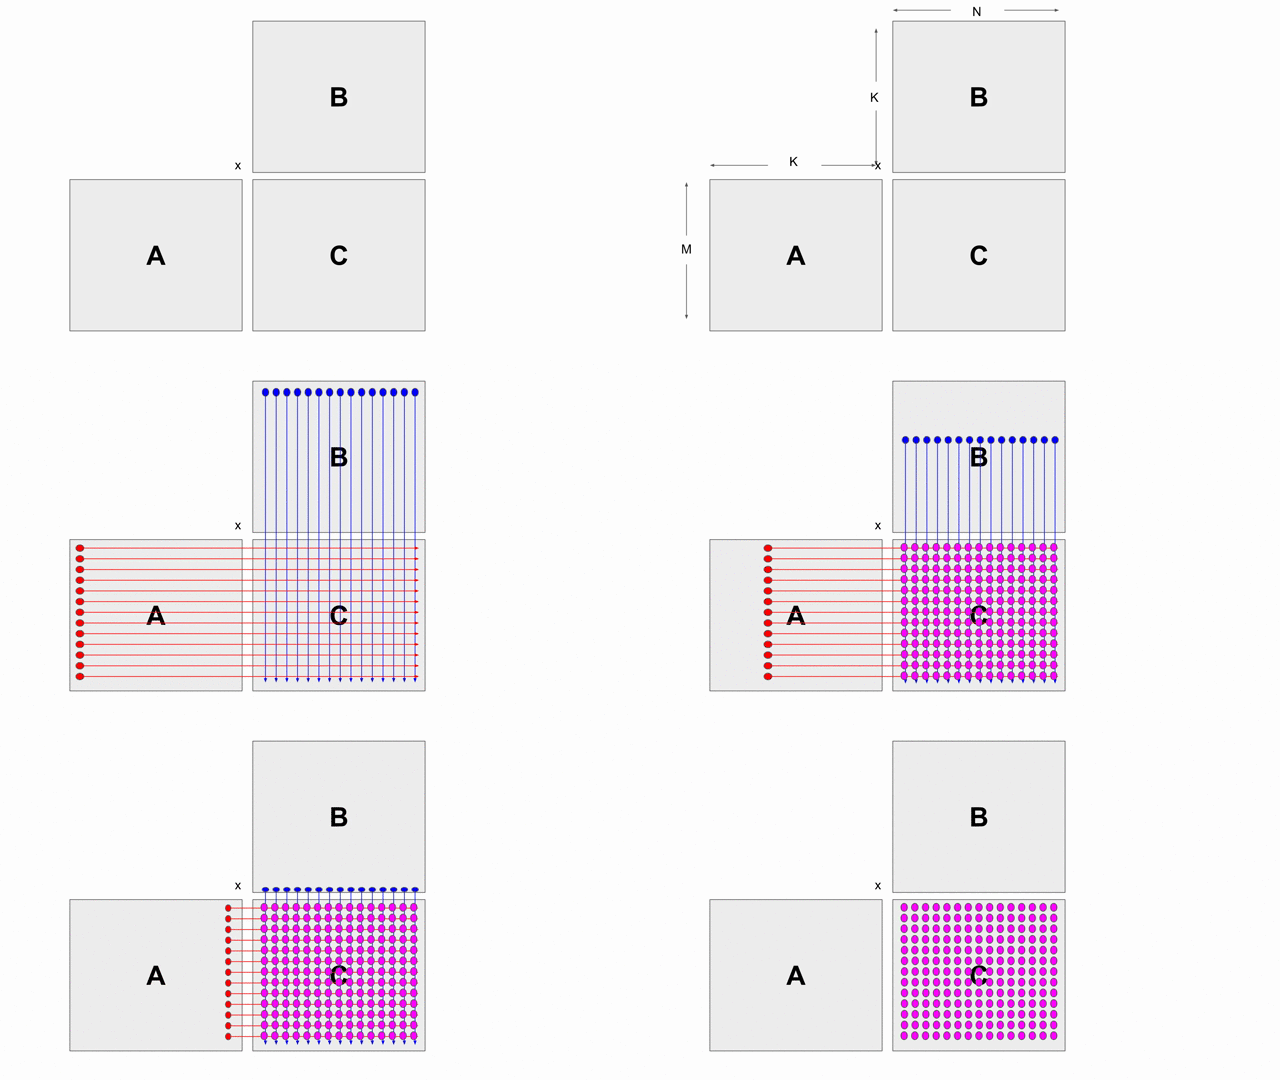
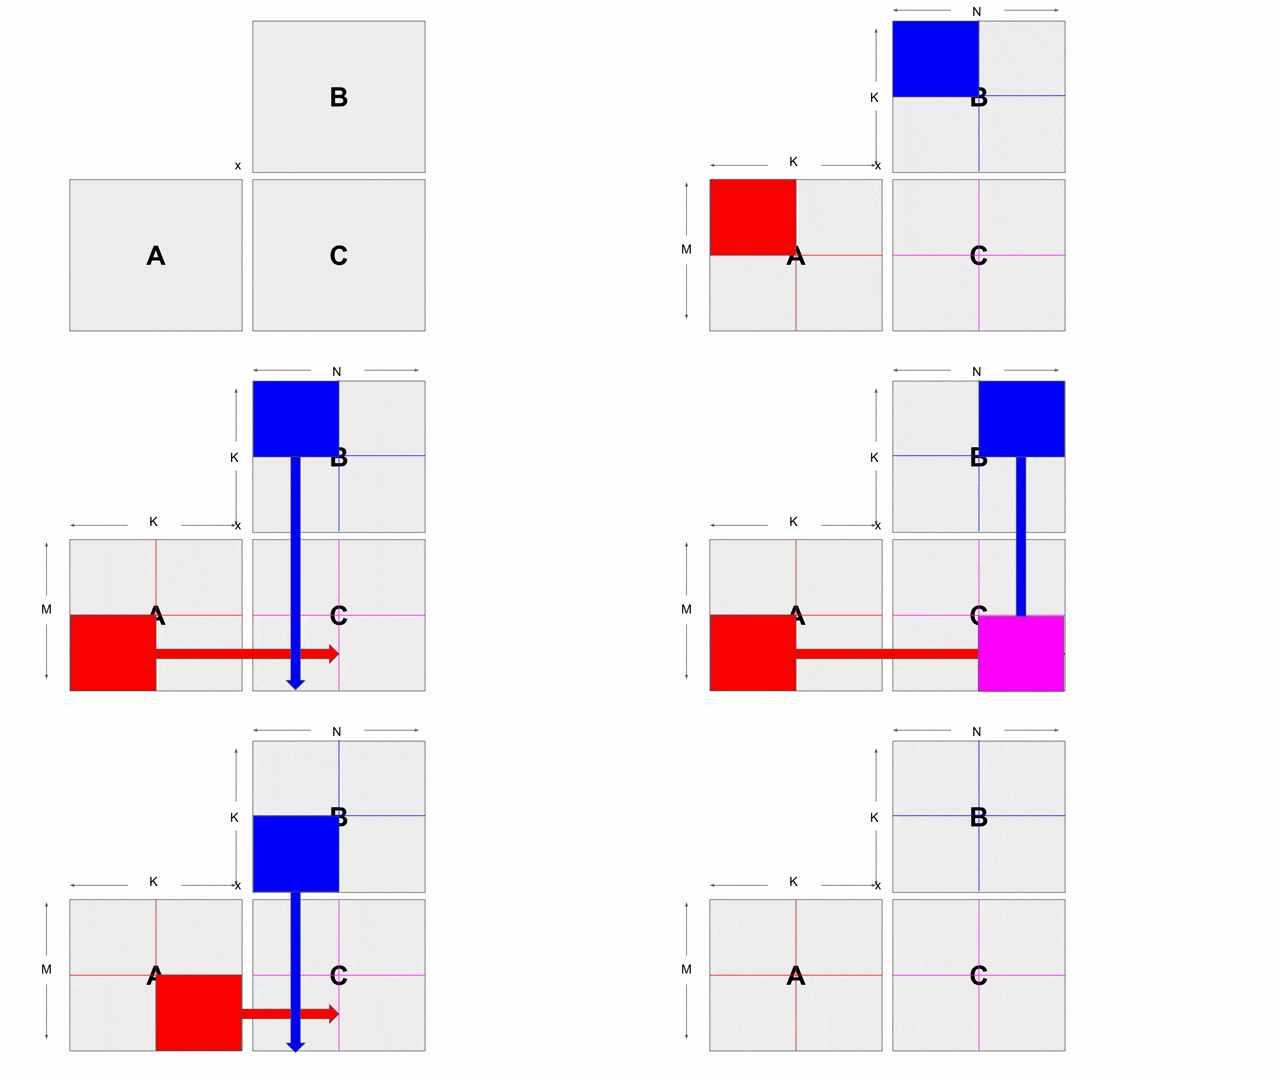
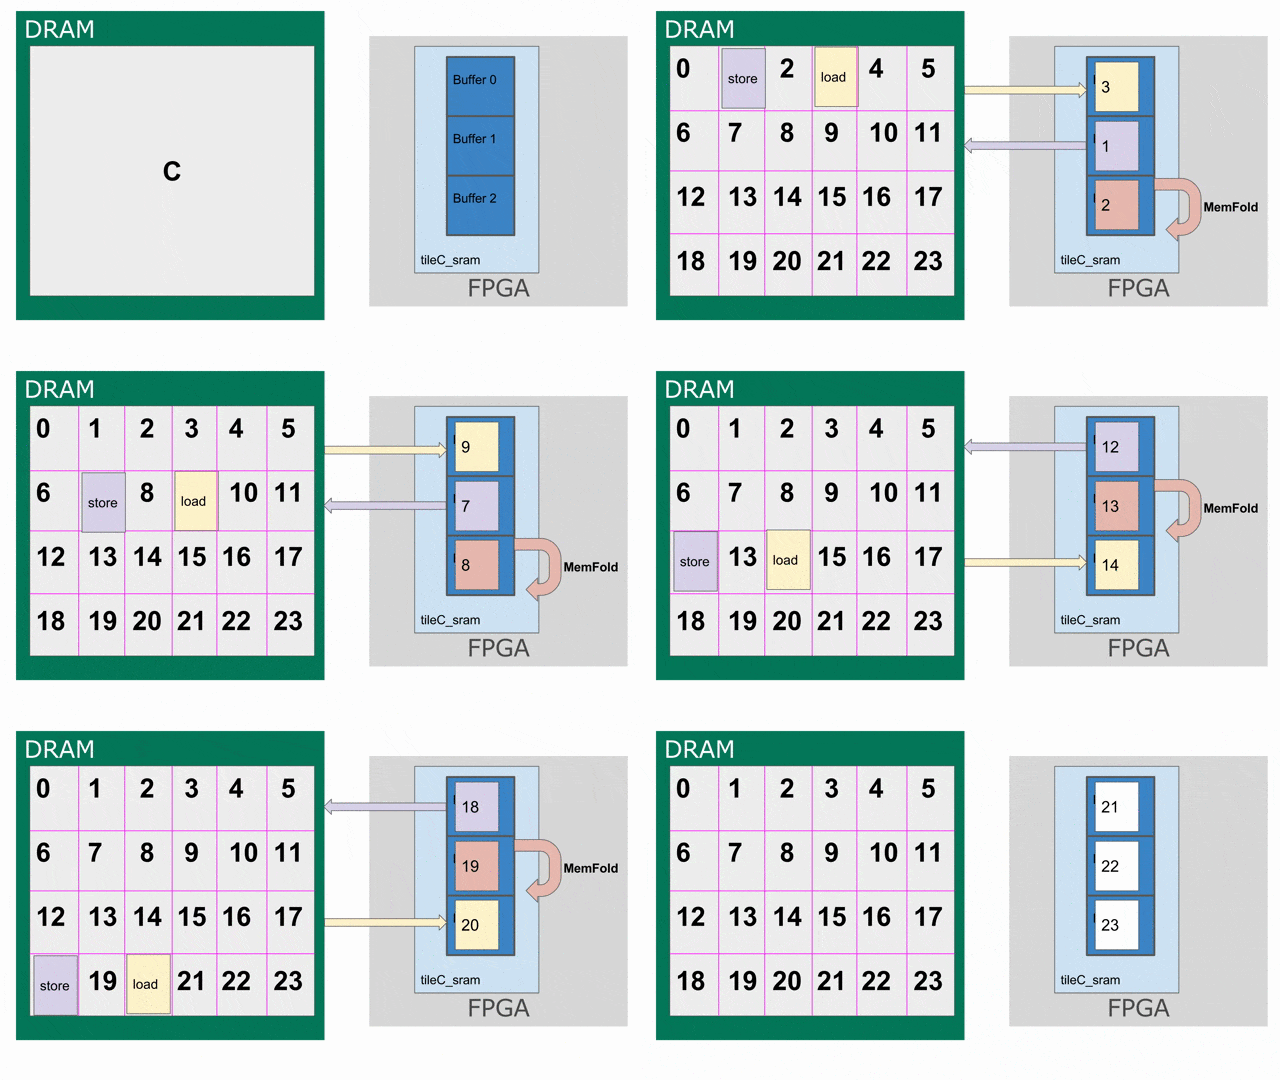
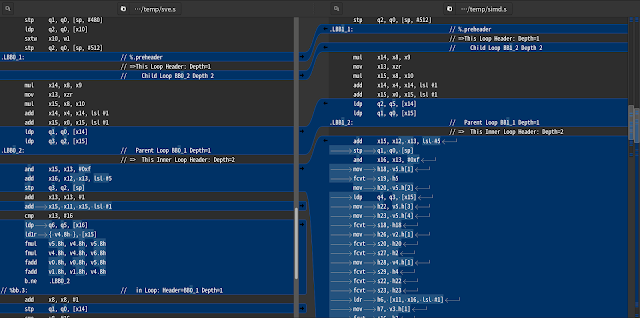
__attribute__ ((target_clones ("avx512f", "avx2", "avx", "sse4.2", "default"))) void gemm_vec(float *a, int sa, float *b, int sb, float *c, int sc) { vfloat vb[TSIZE]; for(int y = 0; y < TSIZE; y++){ vb[y] = *((vfloat*)(b + sb*y)); } for(int y = 0; y < TSIZE; y++){ vfloat vc = *((vfloat*)(c + sc*y)); vfloat va = *((vfloat*)(a + sa*y)); for(int x = 0; x < TSIZE; x++){ vc += va[x] * vb[x]; } *((vfloat*)(c + sc*y)) = vc; } }
接著以 gcc 編譯:
$ gcc -O3 -shared mm.c -o libgemm.so
透過 objdump 觀察
$ objdump -t libgemm.so
可以看到中間有如下的輸出:
0000000000001720 l F .text 0000000000000c96 gemm_vec.default.4 00000000000023c0 l F .text 00000000000005df gemm_vec.avx512f.0 00000000000029a0 l F .text 00000000000005df gemm_vec.avx2.1 0000000000002f80 l F .text 000000000000060c gemm_vec.avx.2 0000000000003590 l F .text 0000000000000c95 gemm_vec.sse4_2.3
對於 gcc/clang 支援的 ?: 是指 a ? b : c 這樣的計算中 的 a 必須是 scalar type, b, c 可以是 scalar or vector ... 因此如此是無法達到最好用的 vector element selection 功能, 也就是當我們撰寫 c = a > b ? a : b; 時於 vector 上等同於:
這篇首先指出一個關鍵:
"Sampling profilers, the most common performance debugging tool, are
notoriously bad at debugging problems caused by tail latency because
they aggregate events into averages. But tail latency is, by definition,
not average."
再者在許多問題的分析上, 從搜尋結果有相當高的可能會得到使用 sampling profiler
的結果, 然而因為對要處理的問題了解不足的結果, 直接套用建議後會發現: "But tools like OProfile are
useless since they'll only tell us what's going on when our RPC is
actively executing. What we really care about is what our thread is
blocked on and why."
在文中舉了一個 Google 內實際發生的例子 - disk read latency
分析, 看似正常的分佈圖然而有著不合理的高延遲存在, (BTW 個人特別喜歡這段的一句 "each of you think of a
guess, and you'll find you're all wrong"), 進而發現長時間廣泛存在於系統層面的問題.
而修正的獲益足以支付分析者十年以上的人事成本. 而這分析的例子主要在於提出 - "is this because of some flaw in
existing profilers, or can profilers provide enough information that
you don't need to use tracing tools to track down rare, long-tail,
performance bugs?"
在討論 sampling limitation 之後, 文末段最後有3個問題, 其中最引人注目應該是: 3. Why are sampling profilers dominant?
除了說明認為未來 profiler 會愈來愈像 tracing tool 外, 也直接的回答了 - "but if we look at
the state of things today, the easiest options are all classical
profilers.", perf 提供運作的時間, 其他的基本工具提供消耗了多少記憶體, 結由這兩個數值能處理主要的效能問題. 此外也指出將現有公開工具湊在一起追蹤效能問題將會是個很困難的體驗, 文中提了一個實際的 case 做例證.
對於 tracing 的問題在於建立的困難度 - 對此通常有兩個選擇 1. 自己實作 - 基本上當然是 event + timestamp, 然而這當中還有該如何針對你的問題建立真的需要存下的 trace.(像是 lock & waiting) 來減少 overhead.
2. 從既有工具挑選你所需要的 - 然而不幸的是這些 overhead 成本都很高, 因此無法在特定規模以上在背景運作來復現出現的問題.
個人觀點:
1. sampling profiler 主要還是建立在 "比較" 的基準上找尋問題點, 通常是版本變換造成行為不同的系統問題.
以此能以成本較低的方式找出, 但若認為一個 workload 是 "正常" 基本上要找出優化的是不容易的, 這類問題像是 task
dispatch 與 thread synchronization.
2. profiling budget 觀念的建立 -
為了能在實際發生問題的當下作用而非事後的分析(因為很多可能是實驗環境而無法 reproducible), 對於產生需要的資訊建立
overhead 要求. 在此之下建立能達成目的的 framework.
3. 統計數據的解讀能力 - 對整體與極端數值的解讀能力是分析問的的根本. 文中對於 disk latency 的 histogram 解釋能力即是一例.
4. sampling 是個好工具, 但必須了解其極限, 以及發現可能問題開如何找下一步
import spatial.dsl._

@spatial object MatMult_outer extends SpatialApp {
  type X = FixPt[TRUE,_16,_16]

  def main(args: Array[String]): Unit = {
    // Get sizes for matrices from command line
    val m = args(0).to[Int]
    val n = args(1).to[Int]
    val p = args(2).to[Int]

    // Generate data for input matrices A and B, and initialize C
    val a = (0::m, 0::p){(i,j) => ((i + j * p) % 8).to[X] }
    val b = (0::p, 0::n){(i,j) => ((i + j * n) % 8).to[X] }
    val c_init = (0::m, 0::n){(_,_) => 0.to[X] }

    // Communicate dimensions to FPGA with ArgIns
    val M = ArgIn[Int]
    val N = ArgIn[Int]
    val P = ArgIn[Int]
    setArg(M,m)
    setArg(N,n)
    setArg(P,p)

    // Create pointers to matrices
    val A = DRAM[X](M, P)
    val B = DRAM[X](P, N)
    val C = DRAM[X](M, N)

    // Set up parallelizations
    val op = 1
    val mp = 1
    val ip = 1

    val bm = 16
    val bn = 64
    val bp = 64

    setMem(A, a)
    setMem(B, b)
    setMem(C, c_init)

    Accel {
      // Tile by output regions in C
      Foreach(M by bm par op, N by bn par op) { (i,j) =>
        val tileC = SRAM[X](bm, bn)

        // Prefetch C tile
        tileC load C(i::i+bm, j::j+bn par ip)

        // Accumulate on top of C tile over all tiles in P dimension
        MemFold(tileC)(P by bp) { k =>
          val tileA = SRAM[X](bm, bp)
          val tileB = SRAM[X](bp, bn)
          val accum = SRAM[X](bm, bn)

          // Load A and B tiles
          Parallel {
            tileA load A(i::i+bm, k::k+bp)
            tileB load B(k::k+bp, j::j+bn)
          }

          // Perform matrix multiply on tile
          MemReduce(accum)(bp by 1 par mp){ kk =>
            val tileC_partial = SRAM[X](bm,bn)
            Foreach(bm by 1, bn by 1 par ip){ (ii,jj) =>
              tileC_partial(ii,jj) = tileA(ii,kk) * tileB(kk,jj)
            }
            tileC_partial
          }{_+_}
        }{_+_}

        // Store C tile to DRAM
        C(i::i+bm, j::j+bn par ip) store tileC
      }
    }

    // Fetch result on host
    val result = getMatrix(C)

    // Compute correct answer
    val gold = (0::m, 0::n){(i,j) =>
      Array.tabulate(p){k => a(i,k) * b(k,j)}.reduce{_+_}
    }

    // Show results
    println(r"expected cksum: ${gold.map(a => a).reduce{_+_}}")
    println(r"result cksum: ${result.map(a => a).reduce{_+_}}")
    printMatrix(gold, "Gold: ")
    printMatrix(result, "Result: ")

    assert(gold == result)
  }

}
import spatial.dsl._

@spatial object MatMult_outer extends SpatialApp {
  type X = FixPt[TRUE,_16,_16]

  def main(args: Array[String]): Unit = {
    val m = args(0).to[Int]
    val n = args(1).to[Int]
    val p = args(2).to[Int]

    val a = (0::m, 0::p){(i,j) => ((i + j * p) % 8).to[X] }
    val b = (0::p, 0::n){(i,j) => ((i + j * n) % 8).to[X] }
    val c_init = (0::m, 0::n){(_,_) => 0.to[X] }

    val M = ArgIn[Int]
    val N = ArgIn[Int]
    val P = ArgIn[Int]
    setArg(M,m)
    setArg(N,n)
    setArg(P,p)

    val A = DRAM[X](M, P)
    val B = DRAM[X](P, N)
    val C = DRAM[X](M, N)

    // *** Set mp and ip > 1
    val op = 1
    val mp = 2
    val ip = 4

    val bm = 16
    val bn = 64
    val bp = 64

    setMem(A, a)
    setMem(B, b)
    setMem(C, c_init)

    Accel {
      Foreach(M by bm par op, N by bn par op) { (i,j) =>
        val tileC = SRAM[X](bm, bn)

        tileC load C(i::i+bm, j::j+bn par ip)


        MemFold(tileC)(P by bp) { k =>
          val tileA = SRAM[X](bm, bp)
          val tileB = SRAM[X](bp, bn)
          val accum = SRAM[X](bm, bn)

          Parallel {
            tileA load A(i::i+bm, k::k+bp)
            // *** Parallelize writer by 8
            tileB load B(k::k+bp, j::j+bn par 8)
          }

          MemReduce(accum)(bp by 1 par mp){ kk =>
            val tileC_partial = SRAM[X](bm,bn)
            Foreach(bm by 1, bn by 1 par ip){ (ii,jj) =>
              tileC_partial(ii,jj) = tileA(ii,kk) * tileB(kk,jj)
            }
            tileC_partial
          }{_+_}
        }{_+_}

        C(i::i+bm, j::j+bn par ip) store tileC
      }
    }

    val result = getMatrix(C)

    val gold = (0::m, 0::n){(i,j) =>
      Array.tabulate(p){k => a(i,k) * b(k,j)}.reduce{_+_}
    }

    println(r"expected cksum: ${gold.map(a => a).reduce{_+_}}")
    println(r"result cksum: ${result.map(a => a).reduce{_+_}}")
    printMatrix(gold, "Gold: ")
    printMatrix(result, "Result: ")

    assert(gold == result)
  }

}
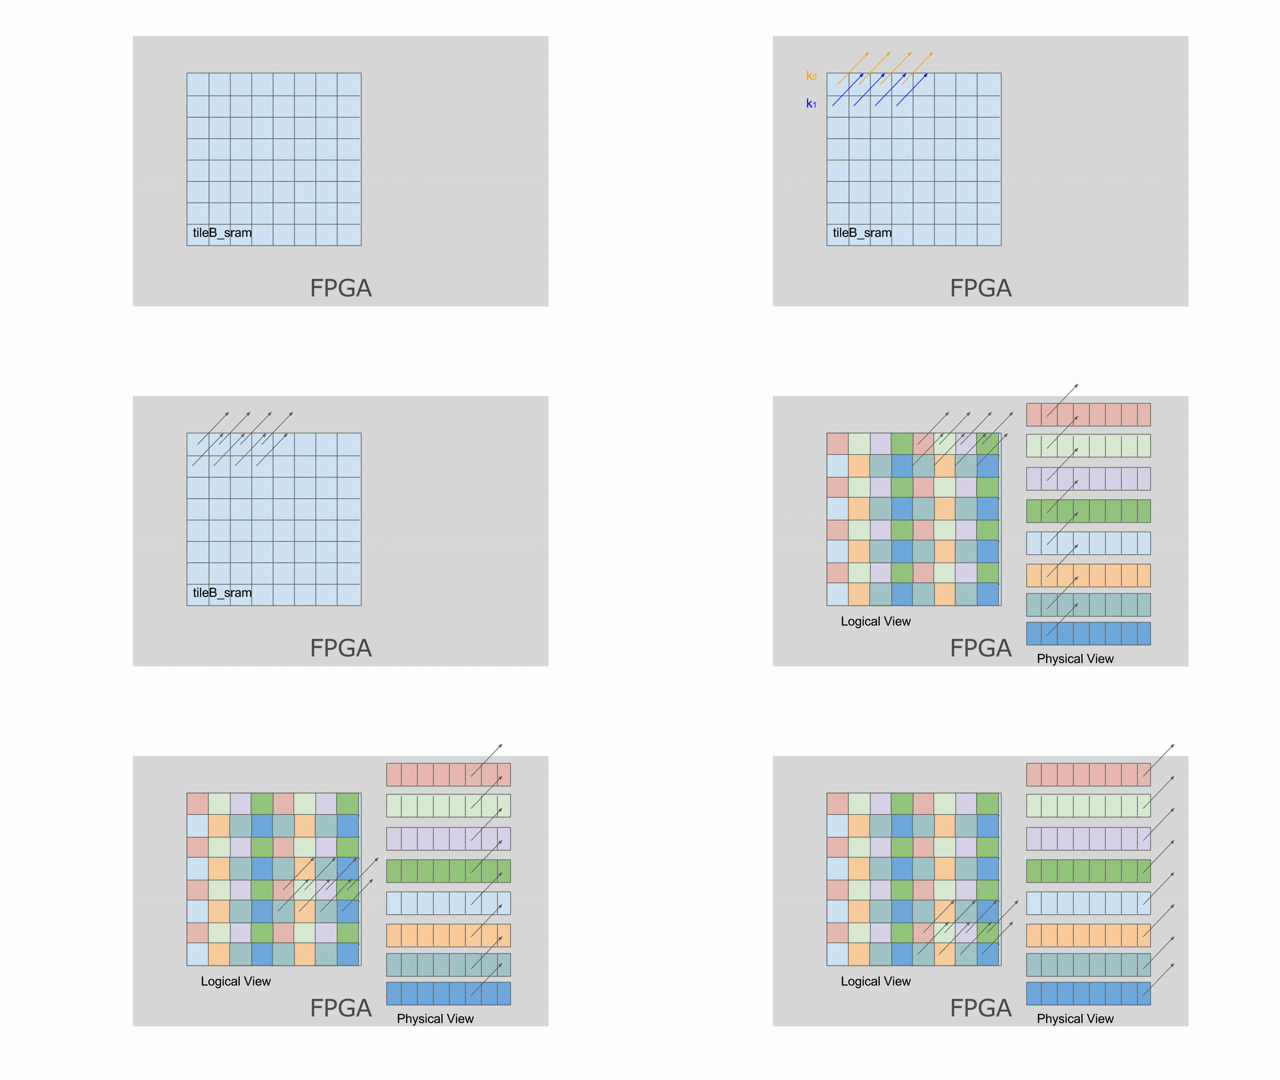
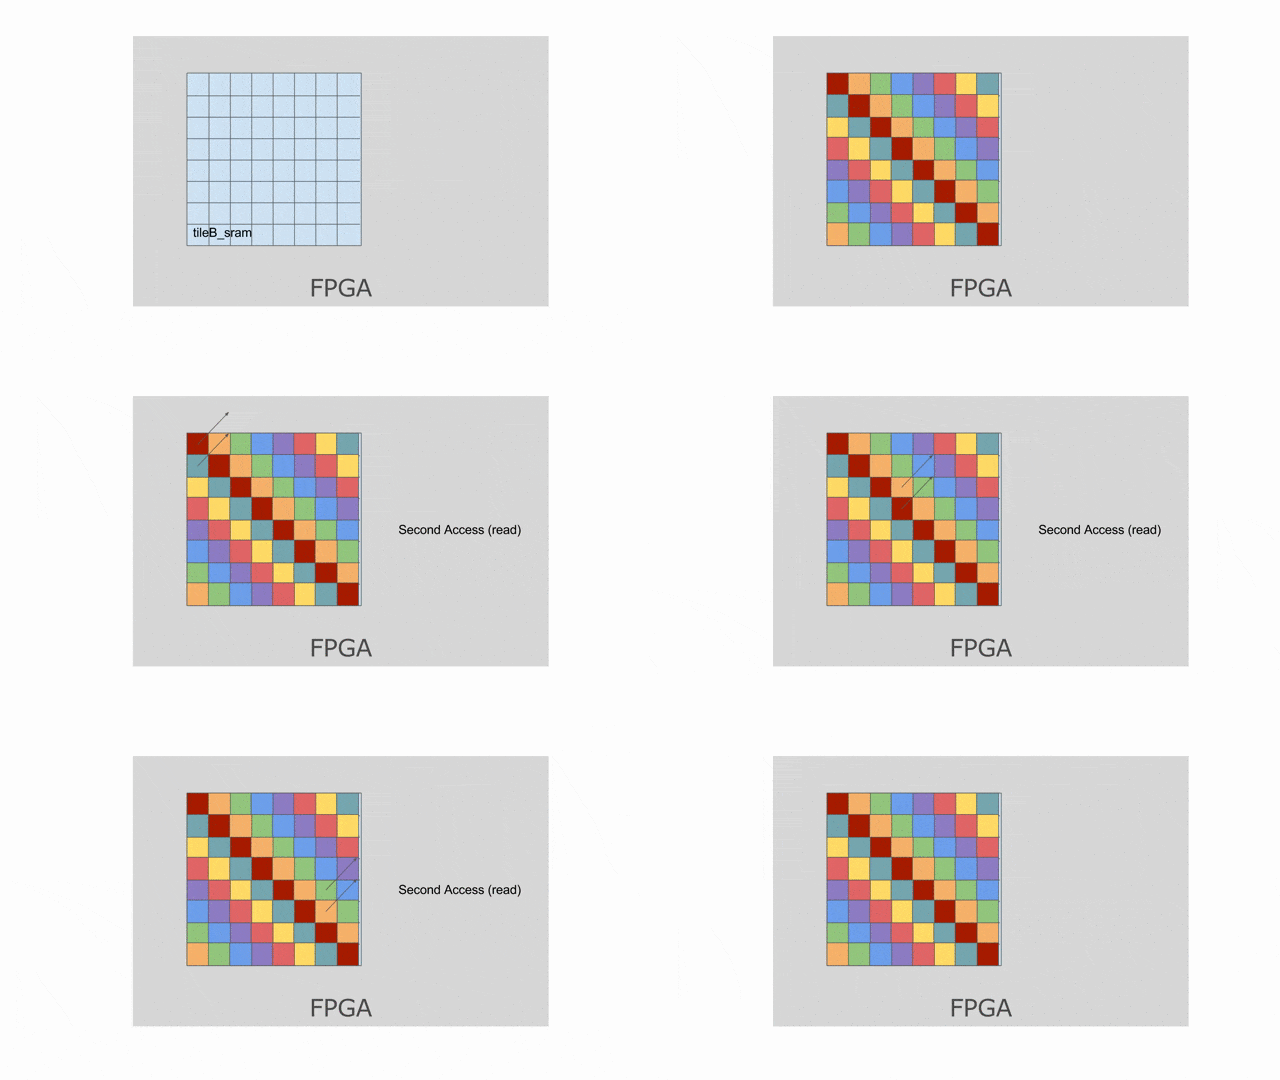
這裡展示 Banking 如何在 Spatial 中作用, 以使用 tileB 作為示範記憶體. Banking 的計算方式基於 “Theory and algorithm for generalized memory partitioning in high-level synthesis” (Wang et al), 並有著次要的修改以及在 pattern 搜尋上的改進.
基本上, 對記憶體切分 bank 是藉由察看所有的存取動作並找出一個沒有衝突的 banking 方案. 更多細節請參考 關於 Spatial 論文的 Appendix A. 將 N 維度記憶體以 1D 空間方式作 bank 切分, 僅在失敗與資源利用上不必要的浪費才以多層的 bank 方式切分.